|
Hurricane Irma contributes to September drop in Orlando home sales Hurricane Irma helped drive Orlando’s home sales down by nearly 20 percent in September compared to September of last year, reports the Orlando Regional REALTOR® Association. In addition, sales decreased by almost 30 percent when compared to last month. “Based on our previous experience with hurricanes, REALTORS® expected September sales to post a decline,” says ORRA President Bruce Elliott, Regal R.E. Professionals LLC. “Hurricanes delay closings due to circumstances such as title companies without power and home damage that requires repair and another inspection. Hurricanes also typically cause a decline in inventory as properties are taken off the market for repair, or as owners stall plans to list their homes while they deal with hurricane aftermath. It’s no surprise that new listings for the month of September dropped by 31 percent compared to September of 2016.” Despite the impact of Hurricane Irma, the median price of Orlando homes sold during the month of September continued its upward trend. The overall median home price (all home types combined) is $225,000, which is 9.8 percent above the September 2016 median price of $205,000. The median price remains unchanged from last month. Year-over-year increases in median price have been recorded for the past 74 consecutive months; as of September 2017, the overall median price is 94.8 percent higher than it was back in July 2011. The median price for single-family homes that changed hands in September increased 8.9 percent over September 2016 and is now $245,000. The median price for condos increased 26.9 percent to $118,000. The overall overage home price for September 2017 is $267,578, an increase of 8.4 percent over the average home price in September 2016. The average home listed for $276,276 in September and sold for 96.9 percent of its listing price (97.1 percent in September 2016). Sales Members of ORRA participated in 2,526 sales of all home types combined in September, which is 18.8 percent less than the 3,110 sales in September 2016 and 29.5 percent less than the 3,580 sales in August 2017. Sales of single-family homes (1,926) in September 2017 decreased by 20.8 percent compared to September 2016, while condo sales (316) decreased 12.0 percent. Sales of distressed homes (foreclosures and short sales) reached only 127 in September and is 60.0 percent less than the 325 distressed sales in September 2016. Distressed sales made up 5.0 percent of all Orlando-area transactions last month. The average interest rate paid by Orlando homebuyers in September was 3.84 percent, down from 3.92 percent the month prior. The overall inventory of homes that were available for purchase in September (8,643) represents a decrease of 16.6 percent when compared to September 2016, and a 2.2 percent decrease compared to last month. There were 14.3 percent fewer single-family homes and 27.9 percent fewer condos. Current inventory combined with the current pace of sales created a 3.4-month supply of homes in Orlando for September. There was a 3.3-month supply in September 2016 and a 2.5-month supply last month. MSA Numbers Sales of existing homes within the entire Orlando MSA (Lake, Orange, Osceola, and Seminole counties) in September were down by 19.3 percent when compared to September of 2016. Year to date, MSA sales are up by 2.3 percent. Each individual county’s sales comparisons are as follows: *Lake: 20.5 percent below September 2016; *Orange: 18.7 percent below September 2016; *Osceola: 15.1 percent below September 2016; and *Seminole: 23.1 percent below September 2016. This representation is based in whole or in part on data supplied by the Orlando Regional REALTOR® Association and the My Florida Regional Multiple Listing Service. Neither the association nor MFRMLS guarantees or is in any way responsible for its accuracy. Data maintained by the association or MFRMLS may not reflect all real estate activity in the market. Due to late closings, an adjustment is necessary to record those closings posted after our reporting date. ORRA REALTOR® sales, referred to as the core market, represent all sales by members of the Orlando Regional REALTOR® Association, not necessarily those sales strictly in Orange and Seminole counties. Note that statistics released each month may be revised in the future as new data is received. Orlando MSA numbers reflect sales of homes located in Orange, Seminole, Osceola, and Lake counties by members of any REALTOR® association, not just members of ORRA. Orlando home sales, median price both rise in August
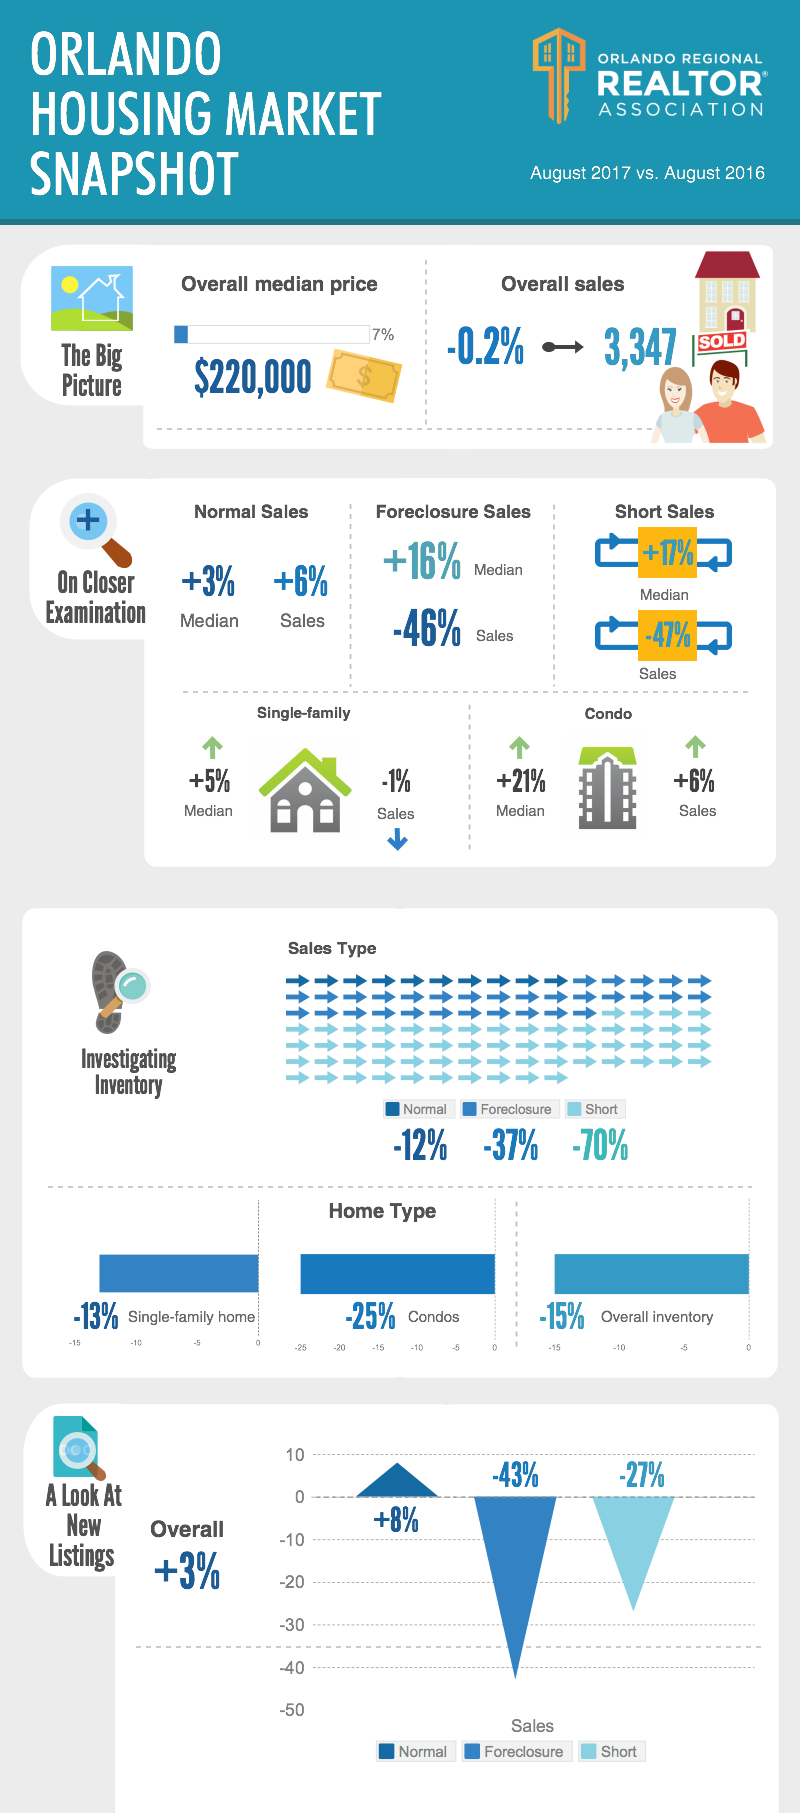
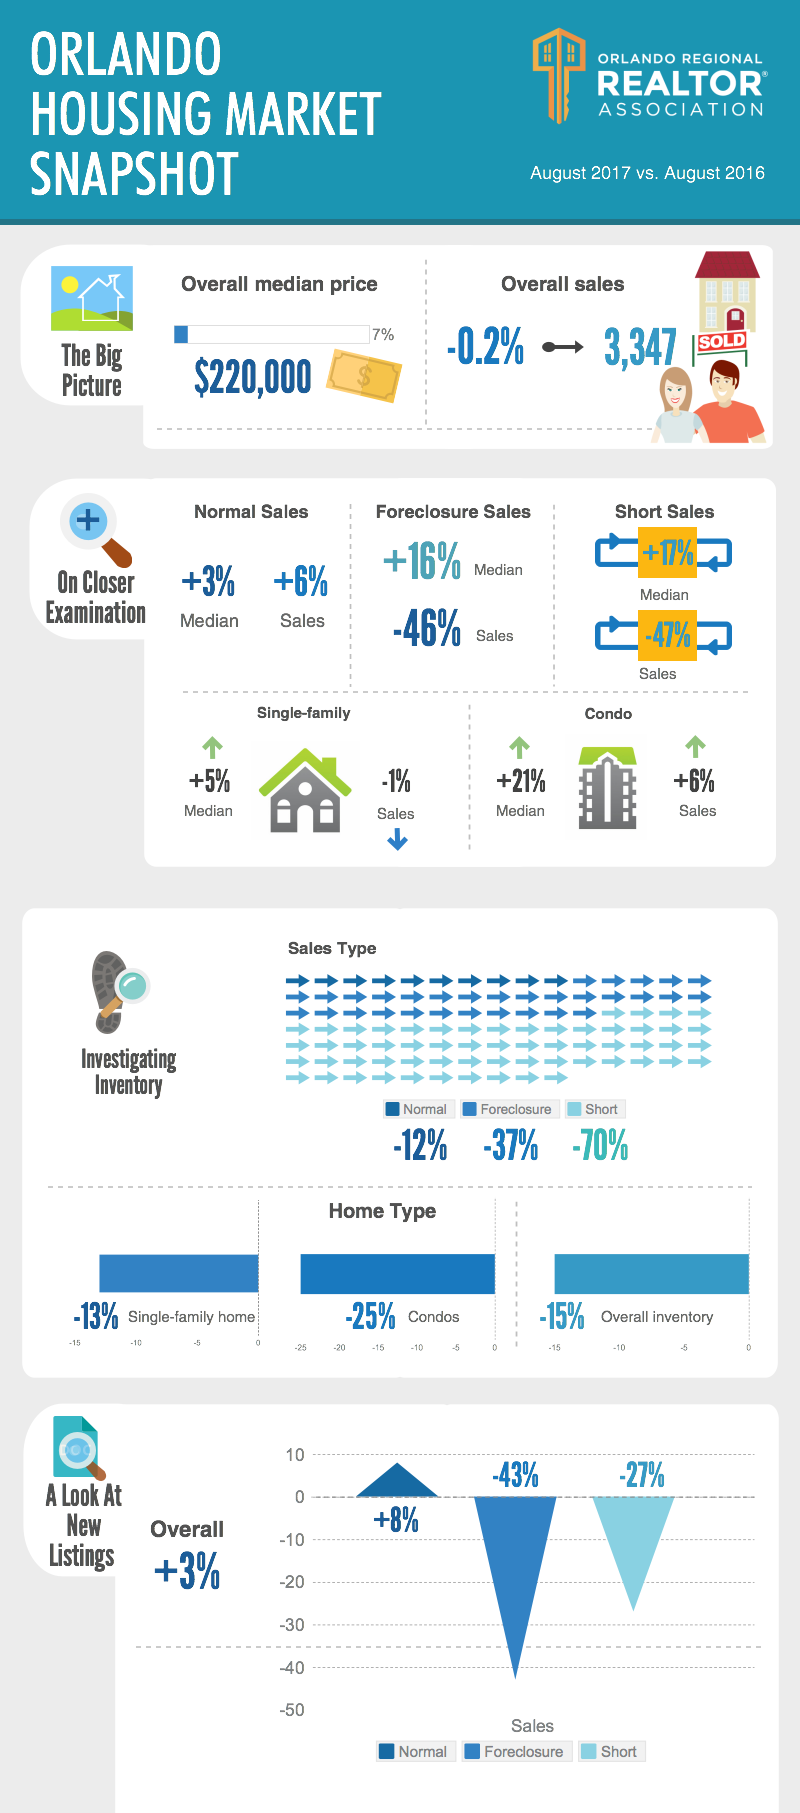
Reminder: This report reflects Orlando's housing market activity during the month of August, prior to Hurricane Irma's landfall on September 10. The market report to be released in October will reflect Orlando’s housing market activity for the month of September along with the impact of Hurricane Irma. The median price of Orlando homes sold during the month of August increased nearly 10 percent while sales increased almost 3 percent compared to August 2016, reports the Orlando Regional REALTOR® Association. Inventory continued its year-over-year slide and dropped about 16 percent. Orlando’s overall median home price (all home types combined) is $225,000, which is 9.8 percent above the August 2016 median price of $205,000. Year-over-year increases in median price have been recorded for the past 73 consecutive months; as of August 2017, the overall median price is 94.8 percent higher than back in July 2011. The median price for single-family homes that changed hands in August increased 7.5 percent over August 2016 and is now $241,850. The median price for condos increased 12.5 percent to $112,500. The overall overage home price for August 2017 is $259,331, an increase of 6.7 percent over the average home price in August 2016. The average home listed for $266,784 in August and sold for 97.2 percent of its listing price (97.3 percent in August 2016). Sales Members of ORRA participated in 3,544 sales of all home types combined in August, which is 2.7 percent more than the 3,451 sales in August 2016 and 4.8 percent more than the 3,381 sales in July 2017. “Buyer interest has held up strongly this summer and homes are selling fast, but inventory continues to dampen sales,” says ORRA President Bruce Elliott, Regal R.E. Professionals LLC. “REALTORS® that I speak with describe prospective buyers who are challenged by a minimal selection of homes that fit their budgets and wish lists, especially in the lower price categories.” Elliott offers hope for struggling buyers by pointing out that autumn typically brings about a decline in competition as the rush to be in a home for the start of school dwindles. “However, with Orlando’s low inventory conditions, buyers shouldn’t expect big discounts in asking price,” continues Elliott. “And they still need to be able to make a decision and put in a solid offer in a timely fashion.” Sales of single-family homes (2,742) in August 2017 increased by 1.3 percent compared to August 2016, while condo sales (422) increased 2.9 percent. Sales of distressed homes (foreclosures and short sales) reached only 204 in August but is still 3.6 percent more than the 197 distressed sales in August 2016. Distressed sales made up 5.8 percent of all Orlando-area transactions last month. The average interest rate paid by Orlando homebuyers in August was 3.92 percent, down from 4.01 percent the month prior. The overall inventory of homes that were available for purchase in August (8,833) represents a decrease of 15.9 percent when compared to August 2016, and a 2.4 percent decrease compared to last month. There were 13.5 percent fewer single-family homes and 27.5 percent fewer condos. Current inventory combined with the current pace of sales created a 2.5-month supply of homes in Orlando for August. There was a 3.0-month supply in August 2016 and a 2.7-month supply last month. MSA Numbers Sales of existing homes within the entire Orlando MSA (Lake, Orange, Osceola, and Seminole counties) in August were up by 2.5 percent when compared to August of 2016. Year to date, MSA sales are up by 5.0 percent. Each individual county’s sales comparisons are as follows: *Lake: 1.2 percent above August 2016; *Orange: 2.8 percent above August 2016; *Osceola: 8.1 percent above August 2016; and *Seminole: 1.7 percent below August 2016. This representation is based in whole or in part on data supplied by the Orlando Regional REALTOR® Association and the My Florida Regional Multiple Listing Service. Neither the association nor MFRMLS guarantees or is in any way responsible for its accuracy. Data maintained by the association or MFRMLS may not reflect all real estate activity in the market. Due to late closings, an adjustment is necessary to record those closings posted after our reporting date. ORRA REALTOR® sales, referred to as the core market, represent all sales by members of the Orlando Regional REALTOR® Association, not necessarily those sales strictly in Orange and Seminole counties. Note that statistics released each month may be revised in the future as new data is received. Orlando MSA numbers reflect sales of homes located in Orange, Seminole, Osceola, and Lake counties by members of any REALTOR® association, not just members of ORRA. Orlando median home price continues upward climb as sales and inventory dip
Orlando home sales declined 4 percent in April compared to April of 2016, in large part the result of sustained declines in the number of homes available for purchase. Orlando’s skimpy inventory also continued to push prices upwards, with the area’s year-over-year median home price again hitting a double-digit increase. Orlando’s overall median home price (all home types combined) is $215,000, which is 12.0 percent above the April 2016 median price of $192,000. Year-over-year increases in median price have been recorded for the past 69 consecutive months; as of April 2017, the overall median is86.2 percent higher than it was back in July 2011. The median price for single-family homes that changed hands in April increased 11.2 percent over April 2016 and is now $233,500. The median price for condos increased 20.0 percent to $108,000. The overall average home price for April 2017 is $252,653, an increase of 9.7 percent over the average home price in April 2016. The average home listed for $260,321 in April and sold for 97.1 percent of its listing price (97.12 percent in April 2016). Sales Members of ORRA participated in 3,061 sales of all home types combined in April, which is 3.5 percent less than the 3,172 sales in April 2016 and 12.0 percent less than the 3,477 sales in March 2017. “Despite the decline in sales compared to last month — March experienced record-setting increase that REALTORS® anecdotally attribute to market-savvy buyers seeking to get a jump on the traditional spring/summer homebuying season — conditions remain favorable to sellers,” says Orlando Regional REALTOR® Association President Bruce Elliott, Regal R.E. Professionals LLC. “We’re seeing buyers compete for homes with tactics such as above-price offers, cash for sellers’ closing costs, and minimal contingencies, particularly for properties within the highly desired under-$300,000 price range. At the higher price points, buyers are more likely to both find a suitable property and successfully negotiate a price reduction.” Sales of single-family homes (2,373) in April 2017 decreased by 4.9 percent compared to April 2016, while condo sales (381) increased 3.0 percent. Sales of distressed homes (foreclosures and short sales) reached only 247 in April and is 56.5 percent less than in April 2016. Distressed sales made up 8.1 percent of all Orlando-area transactions last month. The average interest rate paid by Orlando homebuyers in April was 4.11 percent, down from 4.29 percent the month prior. The overall inventory of homes that were available for purchase in April (8,675) represents a decrease of 17.0 percent when compared to April 2016. There were 16.5 percent fewer single family homes and 20.6 percent fewer condos. Current inventory combined with the current pace of sales created a 2.83-month supply of homes in Orlando for April. There was a 3.29-month supply in April 2016 and a 2.46-month supply last month. MSA Numbers Sales of existing homes within the entire Orlando MSA (Lake, Orange, Osceola, and Seminole counties) in April are down by 2.9 percent when compared to April of 2016. Year to date, MSA sales are up 4.5 percent Each individual county’s sales comparisons are as follows: • Lake: 14.6 percent above April 2016; • Orange: 6.8 percent below April 2016; • Osceola: 0.2 percent above April 2016; and • Seminole: 10.0 percent below April 2016. This representation is based in whole or in part on data supplied by the Orlando Regional REALTOR® Association and the My Florida Regional Multiple Listing Service. Neither the association nor MFRMLS guarantees or is in any way responsible for its accuracy. Data maintained by the association or MFRMLS may not reflect all real estate activity in the market. Due to late closings, an adjustment is necessary to record those closings posted after our reporting date. ORRA REALTOR® sales, referred to as the core market, represent all sales by members of the Orlando Regional REALTOR® Association, not necessarily those sales strictly in Orange and Seminole counties. Note that statistics released each month may be revised in the future as new data is received. Orlando MSA numbers reflect sales of homes located in Orange, Seminole, Osceola, and Lake counties by members of any REALTOR® association, not just members of ORRA. Sales activity versus available inventory drives Orlando's supply of homes to its lowest point since 2013
Buyer activity during the month of March pushed the supply of homes available for purchase in Orlando to just 2.48 months’ worth, the lowest since May of 2013 and swinging the market pendulum further towards favoring sellers. Housing economists consider six months of supply to indicate a market that is balanced between buyers and sellers. “Buyers have turned out in force for the start of Orlando’s traditional spring/summer buying season, enough to drive sales up by nearly 40 percent compared to last month,” says Orlando Regional REALTOR® Association President Bruce Elliott, Regal R.E. Professionals LLC. “The health of Orlando’s economy and job market are significant factors in the jump in sales, as a sense of urgency among buyers trying to beat an anticipated increase in mortgage rates.” “Inventory remains a challenge for buyers, especially in the under-$300,000 range where choices are minimal and prices are being bid higher by multiple offers,” continues Elliott. Orlando’s overall median home price (all home types combined) is $217,000, which is 11.3 percent above the March 2016 median price of $195,000. Year-over-year increases in median price have been recorded for the past 68 consecutive months; as of March 2017, the overall median is 87.9 percent higher than it was back in July 2011. The median price for single-family homes that changed hands in March increased 10.6 percent over March 2016 and is now $234,900. The median price for condos increased 6.3 percent to $102,000. The overall average home price for March 2017 is $253,985, an increase of 10.1 percent over the average home price in March 2016. The average home listed for $261,787 in March and sold for 97.02 percent of its listing price (97.16 percent in March 2016). Sales Members of ORRA participated in 3,437 sales of all home types combined in March, which is 12.4 percent more than the 3,058 sales in March 2016 and 38.5 percent more than the 2,482 sales in February 2017. Sales of single-family homes (2,707) in March 2017 increased by 10.6 percent compared to March 2016, while condo sales (405) increased 18.4 percent. Sales of distressed homes (foreclosures and short sales) reached only 271 in March and is 46.7 percent less than in March 2016. Distressed sales made up 7.9 percent of all Orlando-area transactions last month. The average interest rate paid by Orlando homebuyers in March was 4.29 percent, steady from 4.29 percent the month prior. The overall inventory of homes that were available for purchase in March represents a decrease of 19.3 percent when compared to March 2016. There were 18.7 percent fewer single family homes and 23.5 percent fewer condos. Current inventory combined with the current pace of sales created a 2.48-month supply of homes in Orlando for March. There was a 3.46-month supply in March 2016 and a 3.41-month supply last month. MSA Numbers Sales of existing homes within the entire Orlando MSA (Lake, Orange, Osceola, and Seminole counties) in March are up by 10.8 percent when compared to March of 2016. Year to date, MSA sales are up 6.8 percent Each individual county’s sales comparisons are as follows: • Lake: 21.0 percent above March 2016; • Orange: 9.7 percent above March 2016; • Osceola: 10.8 percent above March 2016; and • Seminole: 5.3 percent above March 2016. This representation is based in whole or in part on data supplied by the Orlando Regional REALTOR® Association and the My Florida Regional Multiple Listing Service. Neither the association nor MFRMLS guarantees or is in any way responsible for its accuracy. Data maintained by the association or MFRMLS may not reflect all real estate activity in the market. Due to late closings, an adjustment is necessary to record those closings posted after our reporting date. ORRA REALTOR® sales, referred to as the core market, represent all sales by members of the Orlando Regional REALTOR® Association, not necessarily those sales strictly in Orange and Seminole counties. Note that statistics released each month may be revised in the future as new data is received. Orlando MSA numbers reflect sales of homes located in Orange, Seminole, Osceola, and Lake counties by members of any REALTOR® association, not just members of ORRA. Orlando housing market ends 2016 with increases in cumulative median price and sales
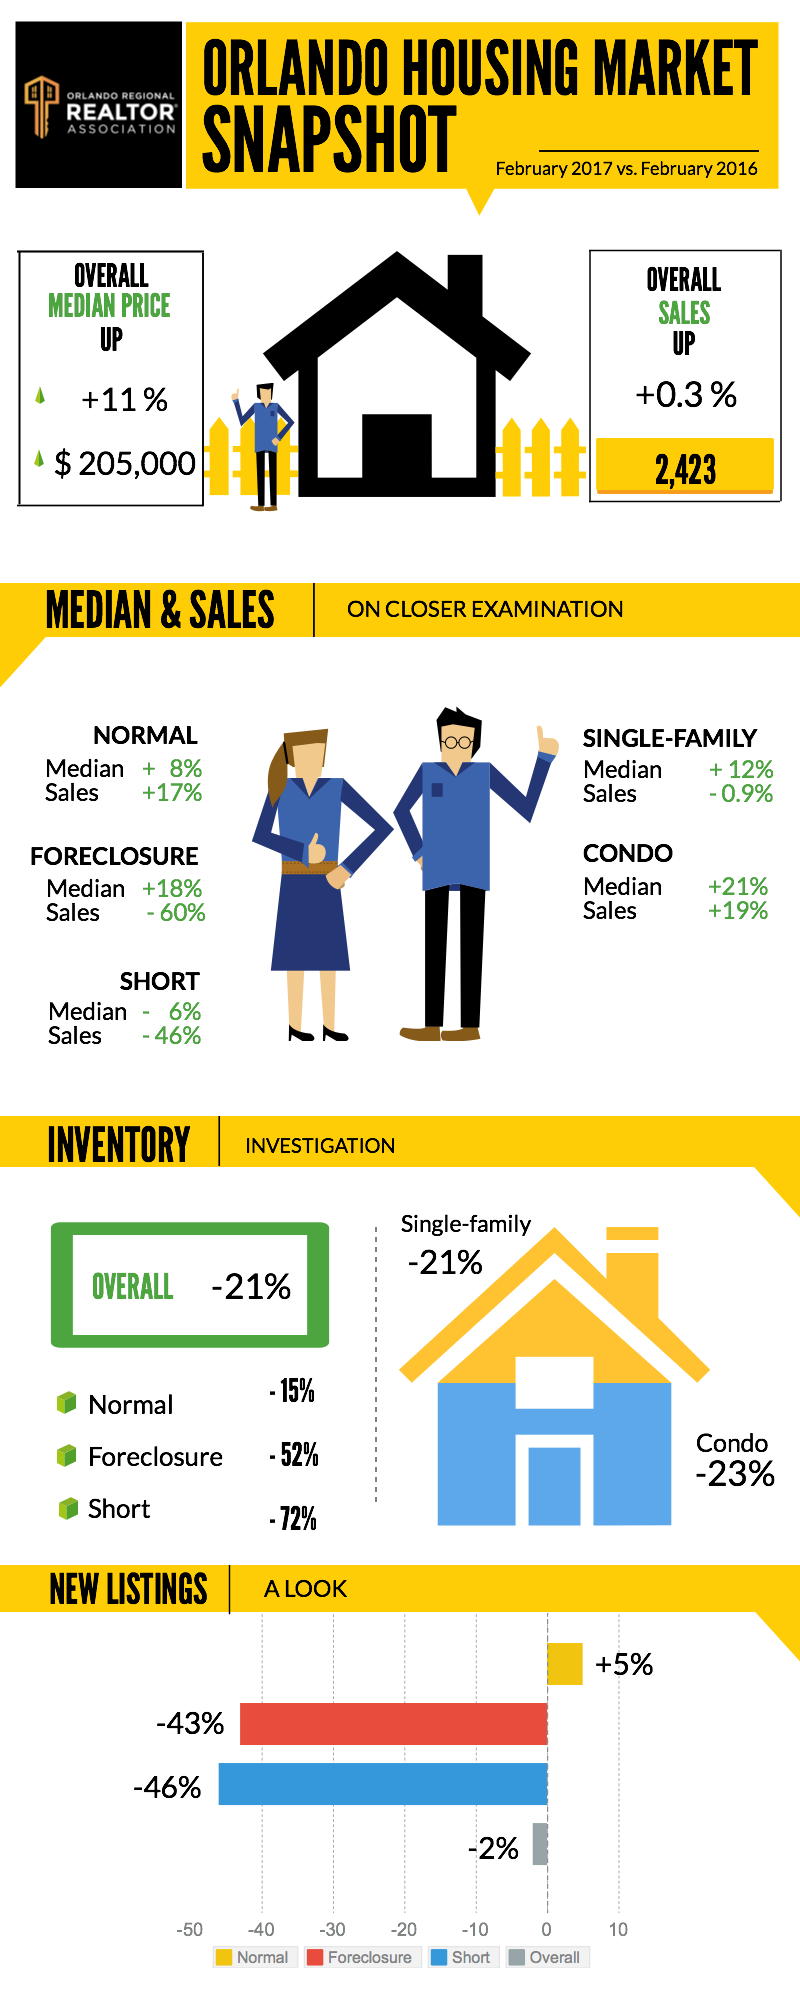
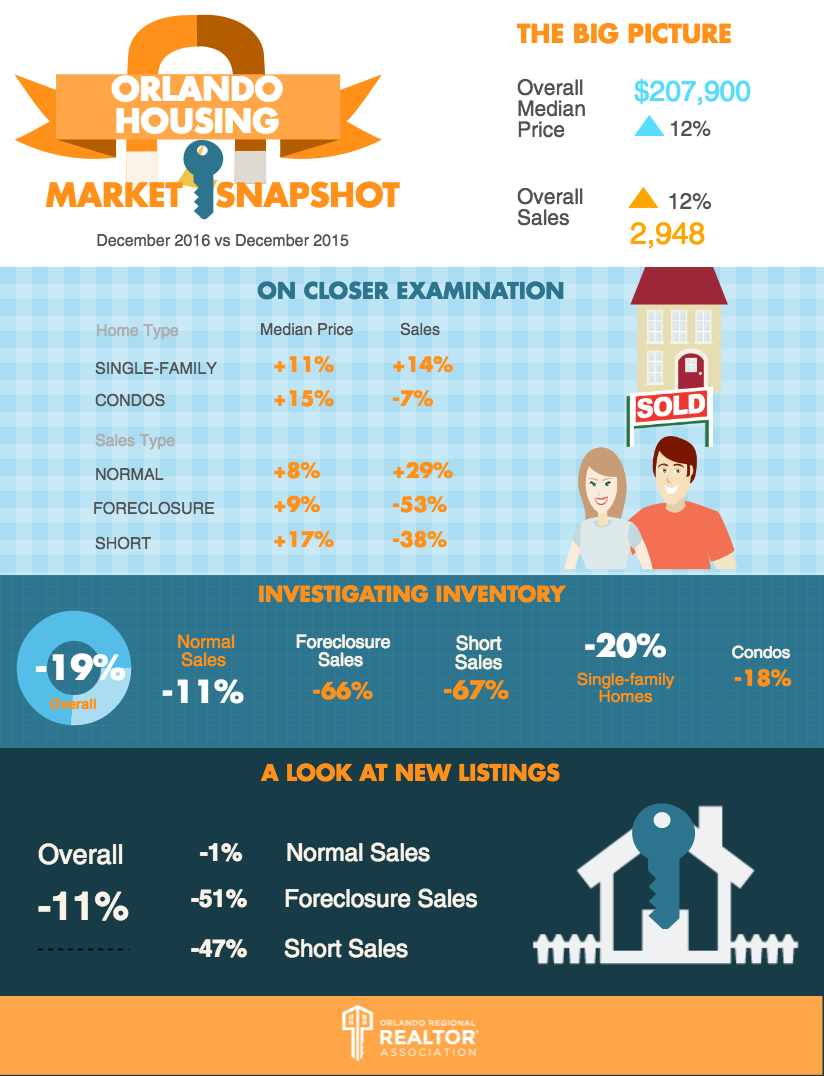
Orlando’s 2016 annual median price ($200,000) is a healthy 12.0 percent higher than the 2015 annual median price ($178,500), thanks to another 12 months of year-over-year price increases. Sales for 2016 finished out at 35,780 and squeaks in at 1.8 percent above the cumulative sales total of 35,151 for 2015. “The most notable trend we saw in 2016 was our consistently declining inventory, which posted year-over-year drops every single month,” says Orlando Regional REALTOR® Association President Bruce Elliott, Regal R.E. Professionals LLC. “Reduced inventory resulted in a year of fewer options for buyers and dampened sales, plus contributed to consistently rising prices.” Editor’s Note: Additional 2016 cumulative statistics are included at the end of this release. December 2016 Market Recap The Orlando housing market experienced increases in both median price and sales in December, while the inventory of homes available for purchase continued its downward trend. Orlando’s overall median home price (all home types combined) is $207,900, which is 12.4 percent above the December 2015 median price of $185,000. Year-over-year increases in median price have been recorded for the past 65 consecutive months; as of December 2016, the overall median is 80.0 percent higher than it was back in July 2011. The median price for single-family homes that changed hands in December increased 10.7 percent over December 2015 and is now $227,000. The median price for condos increased 15.1 percent to $97,750. Members of the Orlando Regional REALTOR Association participated in 2,948 sales of all home types combined in December, which is 11.7 percent more than the 2,639 sales in December 2015. “In addition to the traditional December sales rush by those who wish to take advantage of the tax benefits of homeownership, the possibility of additional increases in mortgage interest rates is likely spurring buyers who want to lock in while they remain at historic lows,” says Elliott. “REALTOR® economists anticipate interest rates to continue rising and reach around the 4.5 percent mark by the end of 2017. Elevated sales is a trend that could persist into the usually slower spring months despite the challenge of Orlando’s limited inventory, especially within the lower-price categories.” Sales of single-family homes (2,347) in December 2016 increased by 14.0 percent compared to December 2015, while condo sales (314) decreased 7.4 percent. Sales of distressed homes (foreclosures and short sales) reached only 287 in December and is a full 50 percent less than in December 2015. Distress sales now make up less than 10 percent of all Orlando-area transactions. The average interest rate paid by Orlando homebuyers in December was 4.32 percent, up from 3.82 percent the month prior. The inventory of single-family homes available for purchase in December represents a decrease of 19.9 percent when compared to December 2015. There are 18.4 percent fewer condos available. MSA Numbers Sales of existing homes within the entire Orlando MSA (Lake, Orange, Osceola, and Seminole counties) in December are down by 1.1 percent when compared to December of 2015. Each individual county’s monthly sales comparisons are as follows: • Lake: 1.7 percent below December 2015; • Orange: 1.0 percent below December 2015; • Osceola: 4.4 percent above December 2015; and • Seminole: 5.2 percent below December 2015. 2016 Annual Market Recap (cumulative 2016 totals compared to cumulative 2015 totals) Median Price • The 2016 median price of $200,000 is an increase of 12.0 percent when compared to 2015’s median price of $178,500. • The annual median price of single-family homes increased 12.8 percent to $220,000 in 2016, while the median price of condos increased 7.3 percent to $95,000. The median for duplexes, town homes, and villas increased 10 percent. • The 2016 median price of normal homes increased 5 percent to $210,000. The short sales median price increased by 8.7 percent and the bank-owned median price increased by 8.0 percent. Sales • Sales in 2016 were up by 1.8 percent over 2015. A total of 35,780 homes were sold in 2016 compared to 35,151 the previous year. • Sales of single-family homes increased 2.4 percent over 2015, while condo sales decreased 3.5 percent. Sales of duplexes, town homes, and villas increased 3.5 percent. • Normal sales increased by 21.1 percent in 2016. Foreclosure sales decreased 53.0 percent in 2016, and short sales decreased by 30.0 percent. • By year’s end in 2016, 43,009 homes were sold in the Orlando MSA whereas 43,130 homes had been sold by year’s end in 2015, for a 0.3 percent decrease. This representation is based in whole or in part on data supplied by the Orlando Regional REALTOR® Association and the My Florida Regional Multiple Listing Service. Neither the association nor MFRMLS guarantees or is in any way responsible for its accuracy. Data maintained by the association or MFRMLS may not reflect all real estate activity in the market. Due to late closings, an adjustment is necessary to record those closings posted after our reporting date. ORRA REALTOR® sales, referred to as the core market, represent all sales by members of the Orlando Regional REALTOR® Association, not necessarily those sales strictly in Orange and Seminole counties. Note that statistics released each month may be revised in the future as new data is received. Orlando MSA numbers reflect sales of homes located in Orange, Seminole, Osceola, and Lake counties by members of any REALTOR® association, not just members of ORRA. |
|
Call/Text Us: 321-439-4030
© COPYRIGHT 2016. ALL RIGHTS RESERVED.
|
|



 RSS Feed
