 Orlando home sales, median price increase along with mortgage rate in November
Orlando home sales experienced a 7 percent year-over-year jump in November, along with a 9 percent increase in median price. The average interest rate paid by an Orlando homebuyer is November is 3.82 percent, up from 3.57 percent. Orlando Regional REALTOR® Association President John Lazenby, Colony Realty Group, Inc., points out that buyer demand lifted year-over-year sales despite a dramatic drop in the number of homes available for purchase that occurred in November. “The substantial decrease in inventory — nearly 18 percent compared to November 2015 — can be attributed in part to the shifting of “Active With Contract” listings from the “Active Inventory” category to the “Pending” category within our local multiple listing system, a process that took place in November” explains Lazenby. “After adjusting for the elimination of “Active With Contract” homes, the November 2016 inventory is 12.40 percent lower than in November 2015 and more in line with the decreases we have seen this year.” “The “Active With Contract” status was initiated by the multiple listing system in the spring of 2011 to accommodate the influx of short sales onto the Orlando area housing market,” continues Lazenby. “Now that short sales account for so little of Orlando area’s inventory, in fact only four percent in November, the status has been removed.” The transfer of “Active With Contract” homes into “Pending” status also resulted in an increase of 9 percent when comparing the number of pending homes in November to the number of pending homes last month, and an increase of 19 percent in the number of homes flagged as newly under contract. Median Price The overall median price (all sales types and all home types combined) for the month of November 2016 is $200,000, a 8.70 percent jump compared to the $184,000 median price in November 2015. The median price is 2.44 percent below the October 2016 median of $205,000. The Orlando median home price has now experienced year-over-year increases for the past 64 consecutive months; as of November the median price is 73.16 percent higher than it was in July 2011. The year-to-year median price of normal sales increased 5.00 percent, while the median price for foreclosure sales increased 20.00 percent and short sales decreased 9.38 percent. The median price of single-family homes rose 10.79 percent when compared to November of last year, and the median price of condos increased 16.00 percent. Completed Sales Members of ORRA participated in the sale of 2,481 homes (all home types and all sale types combined) that closed in November 2016, an increase of 6.71 percent compared to November 2015. Sales decreased by 8.15 percent in November when compared to last month. Sales of normal homes increased 22.94 percent in November 2016, while foreclosures decreased 52.61 percent and short sales decreased 25.00 percent. Sales of single-family homes increased 8.42 percent year over year; condo sales increased 0.36 percent. Homes of all types spent an average of 66 days on the market before coming under contract in November 2016, and the average home sold for 96.93 percent of its listing price. In November 2015 those numbers were 68 days and 97.00 percent, respectively. The average interest rate paid by Orlando homebuyers in November was 3.82 percent. Last month, the average interest rate was 3.57 percent, while in November of last year homebuyers paid an average interest rate of 4.01 percent. Pending Sales Pending sales – those under contract and awaiting closing – are currently at 5,122. The number of pending sales in November 2016 is 1.18 percent lower than it was in November 2015 and 8.54 percent higher than it was in October 2016. Normal properties made up 76.94 percent of pending sales in November 2016. Short sales accounted for 13.65 percent, while bank-owned properties accounted for 9.41 percent. Inventory The number of existing homes (all types combined) that were available for purchase in November is 17.96 percent below that of November 2015 and now rests at 9,270. Note: When adjusted for the elimination of “Active With Contract” status homes from of the active listings category within the local multiple listing service — a process that began in November — the November 2016 inventory is 12.40 percent lower than in November 2015. Inventory decreased by 7.53 percent (755 homes in number) compared to last month. The inventory of normal homes decreased 8.85 percent, while foreclosures decreased 70.47 percent and short sales decreased 51.69 percent. The inventory of single-family homes is down by 19.12 percent when compared to November of 2015, while condo inventory is down by 14.44 percent. The inventory of duplexes, townhomes, and villas is down by 13.45 percent. Current inventory combined with the current pace of sales created a 3.74-month supply of homes in Orlando for November. There was a 4.86-month supply in November 2015 and a 3.71-month supply last month. Affordability The November affordability index is 160.37, a tiny decrease from October’s 161.08 percent. (An affordability index of 99 percent means that buyers earning the state-reported median income are 1 percent short of the income necessary to purchase a median-priced home. Conversely, an affordability index that is over 100 means that median-income earners make more than is necessary to qualify for a median-priced home.) Buyers who earn the reported median income of $57,494 can qualify to purchase one of 3,540 homes in Orange and Seminole counties currently listed in the local multiple listing service for $320,737 or less. First-time homebuyer affordability in November decreased to 114.04 from last month’s 114.55 percent. First-time buyers who earn the reported median income of $39,096 can qualify to purchase one of the 1,593 homes in Orange and Seminole counties currently listed in the local multiple listing service for $193,868 or less. Condos and Town Homes/Duplexes/Villas The sales of condos in the Orlando area were up by 0.36, with 281 sales recorded in November 2016 compared to 280 in November 2015. Orlando homebuyers purchased 229 duplexes, town homes, and villas in November 2016, which is 0.88 percent less than in November 2015. MSA Numbers Sales of existing homes within the entire Orlando MSA (Lake, Orange, Osceola, and Seminole counties) in November (3,037) were up by 5.23 percent when compared to November of 2015 (2,886). To date, sales in the MSA are down 0.27 percent. Each individual county’s monthly sales comparisons are as follows: • Lake: 18.89 percent above November 2015; • Orange: 2.88 percent below November 2015; • Osceola: 19.23 percent above November 2015; and • Seminole: 5.77 percent above November 2015. This representation is based in whole or in part on data supplied by the Orlando Regional REALTOR® Association and the My Florida Regional Multiple Listing Service. Neither the association nor MFRMLS guarantees or is in any way responsible for its accuracy. Data maintained by the association or MFRMLS may not reflect all real estate activity in the market. Due to late closings, an adjustment is necessary to record those closings posted after our reporting date. ORRA REALTOR® sales, referred to as the core market, represent all sales by members of the Orlando Regional REALTOR® Association, not necessarily those sales strictly in Orange and Seminole counties. Note that statistics released each month may be revised in the future as new data is received. Orlando MSA numbers reflect sales of homes located in Orange, Seminole, Osceola, and Lake counties by members of any REALTOR® association, not just members of ORRA.
0 Comments
 Orlando median price continues its upward trend as sales and inventory slip
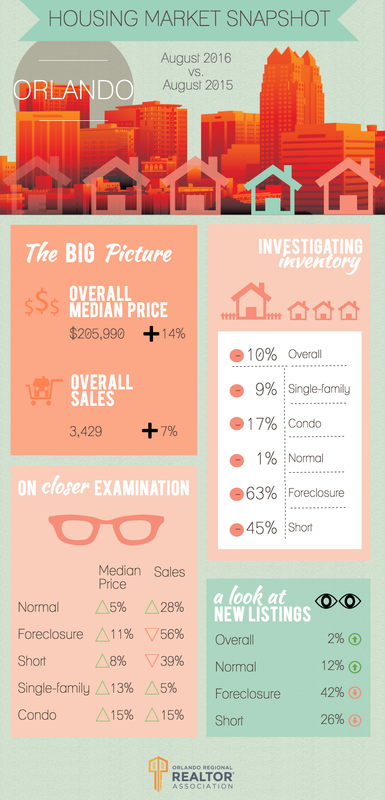
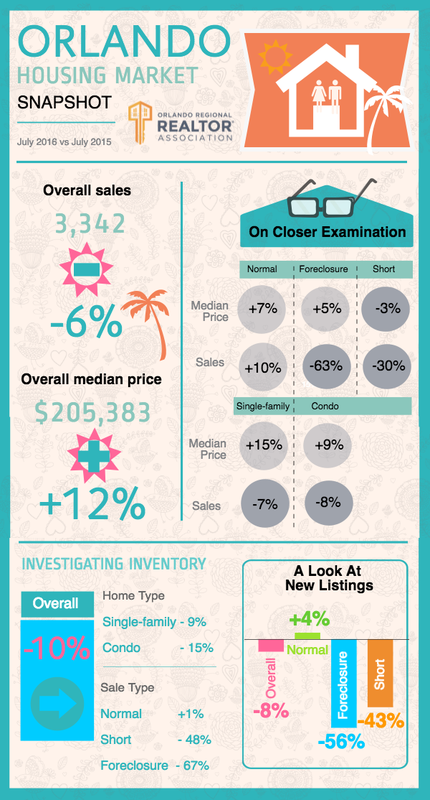
The median price of Orlando area homes rose 14 percent year-over-year in October. Meanwhile, sales decreased 8 percent as inventory took its greatest year-over-year tumble in 2016 and dropped by 12 percent. “October’s drop in sales can be attributed to a mix of the disruption caused by Hurricane Matthew and uncertainty caused by the election, in addition to our continuing challenge of declines in homes available for purchase,” explains Orlando Regional REALTOR® Association President John Lazenby, Colony Realty Group. “Immediately after even a mild hurricane without much damage, scheduled closings can be delayed by the need for additional appraisals or inspections, while sellers can put off listing their homes for a week or more,” says Lazenby. “And of course an election year brings a natural state of uncertainty to the housing market as both buyers and sellers wait to see what the future brings. For many people, a home represents the largest investment of their life, so during an election year they delay taking action until the economy is less of an unknown. This phenomenon can be seen in the “New Listings” tally for the month, which dropped by 17 percent compared to October 2015 despite Orlando’s current market conditions that strongly favor sellers.” Median Price The overall median price (all sales types and all home types combined) for the month of October 2016 is $205,000, a 13.95 percent jump compared to the $179,900 median price in October 2015. The median price is steady compared to the September 2016 median of also $205,000. The Orlando median home price has now experienced year-over-year increases for the past 63 consecutive months; as of October the median price is 77.49 percent higher than it was in July 2011. The year-to-year median price of normal sales increased 8.30 percent, while the median price for foreclosure sales increased 16.60 percent and short sales increased 20.00 percent. The median price of single-family homes increased 14.13 percent when compared to October of last year, and the median price of condos increased 9.08 percent. Completed Sales Members of ORRA participated in the sale of 2,654 homes (all home types and all sale types combined) that closed in October 2016, a decrease of 7.75 percent compared to October 2015. Sales decreased by 14.66 percent in October when compared to last month. Sales of normal homes increased 6.08 percent in October 2016, while foreclosures decreased 57.12 percent and short sales decreased 32.43 percent. Sales of single-family homes decreased 6.38 percent year over year; condo sales decreased 14.03 percent. Homes of all types spent an average of 61 days on the market before coming under contract in October 2016, and the average home sold for 96.88 percent of its listing price. In October 2015 those numbers were 71 days and 96.76 percent, respectively. The average interest rate paid by Orlando homebuyers in October was 3.57 percent. Last month, the average interest rate was 3.53 percent, while in October of last year homebuyers paid an average interest rate of 3.86 percent. Pending Sales Pending sales – those under contract and awaiting closing – are currently at 4,719. The number of pending sales in October 2016 is 10.64 percent lower than it was in October 2015 and 2.72 percent higher than it was in September 2016. Normal properties made up 75.19 percent of pending sales in October 2016. Short sales accounted for 14.45 percent, while bank-owned properties accounted for 10.36 percent. Inventory The number of existing homes (all types combined) that were available for purchase in October is 12.15 percent below that of October 2015 and now rests at 10,025. Inventory decreased by 3.25 percent (337 homes in number) compared to last month. The inventory of normal homes decreased 2.28 percent, while foreclosures decreased 67.11 percent and short sales decreased 46.12 percent. The inventory of single-family homes is down by 12.67 percent when compared to October of 2015, while condo inventory is down by 13.81 percent. The inventory of duplexes, townhomes, and villas is down by 4.27 percent. Current inventory combined with the current pace of sales created a 3.78-month supply of homes in Orlando for October. There was a 3.97-month supply in October 2015 and a 3.33-month supply last month. Affordability The October affordability index is 161.08, a tiny decrease from October’s 161.74 percent. (An affordability index of 99 percent means that buyers earning the state-reported median income are 1 percent short of the income necessary to purchase a median-priced home. Conversely, an affordability index that is over 100 means that median-income earners make more than is necessary to qualify for a median-priced home.) Buyers who earn the reported median income of $57,437 can qualify to purchase one of 4,214 homes in Orange and Seminole counties currently listed in the local multiple listing service for $330,217 or less. First-time homebuyer affordability in October decreased to 114.55 from last month’s 115.02 percent. First-time buyers who earn the reported median income of 39,057 can qualify to purchase one of the 1,953 homes in Orange and Seminole counties currently listed in the local multiple listing service for $199,598 or less. Condos and Town Homes/Duplexes/Villas The sales of condos in the Orlando area were down by 14.03 percent, with 288 sales recorded in October 2016 compared to 335 in October 2015. Orlando homebuyers purchased 237 duplexes, town homes, and villas in October 2016, which is 11.57 percent less than in October 2015. MSA Numbers Sales of existing homes within the entire Orlando MSA (Lake, Orange, Osceola, and Seminole counties) in October (3,150) were down by 8.27 percent when compared to October of 2015 (3,434). To date, sales in the MSA are down 0.86 percent. Each individual county’s monthly sales comparisons are as follows: • Lake: 2.49 percent below October 2015; • Orange: 9.56 percent below October 2015; • Osceola: 14.54 percent below October 2015; and • Seminole: 4.07 percent below October 2015. This representation is based in whole or in part on data supplied by the Orlando Regional REALTOR® Association and the My Florida Regional Multiple Listing Service. Neither the association nor MFRMLS guarantees or is in any way responsible for its accuracy. Data maintained by the association or MFRMLS may not reflect all real estate activity in the market. Due to late closings, an adjustment is necessary to record those closings posted after our reporting date. ORRA REALTOR® sales, referred to as the core market, represent all sales by members of the Orlando Regional REALTOR® Association, not necessarily those sales strictly in Orange and Seminole counties. Note that statistics released each month may be revised in the future as new data is received. Orlando MSA numbers reflect sales of homes located in Orange, Seminole, Osceola, and Lake counties by members of any REALTOR® association, not just members of ORRA.  Team NRGFL's Oviedo, FL Market Update for September 2016 is now posted.
Below is a list of the recent stats. Number of closed sales: 88 Average Sold Price: $266,574 Number of Active Listings: 77 Average Number of Days on the Market: 35 Days Average Price/Sqft: $135 In addition to an increase in the average sales price compared to last year, Oviedo is also noticing a huge growth in new home construction. There are now over 6 large home builders that are breaking ground in Oviedo. More updates to come. 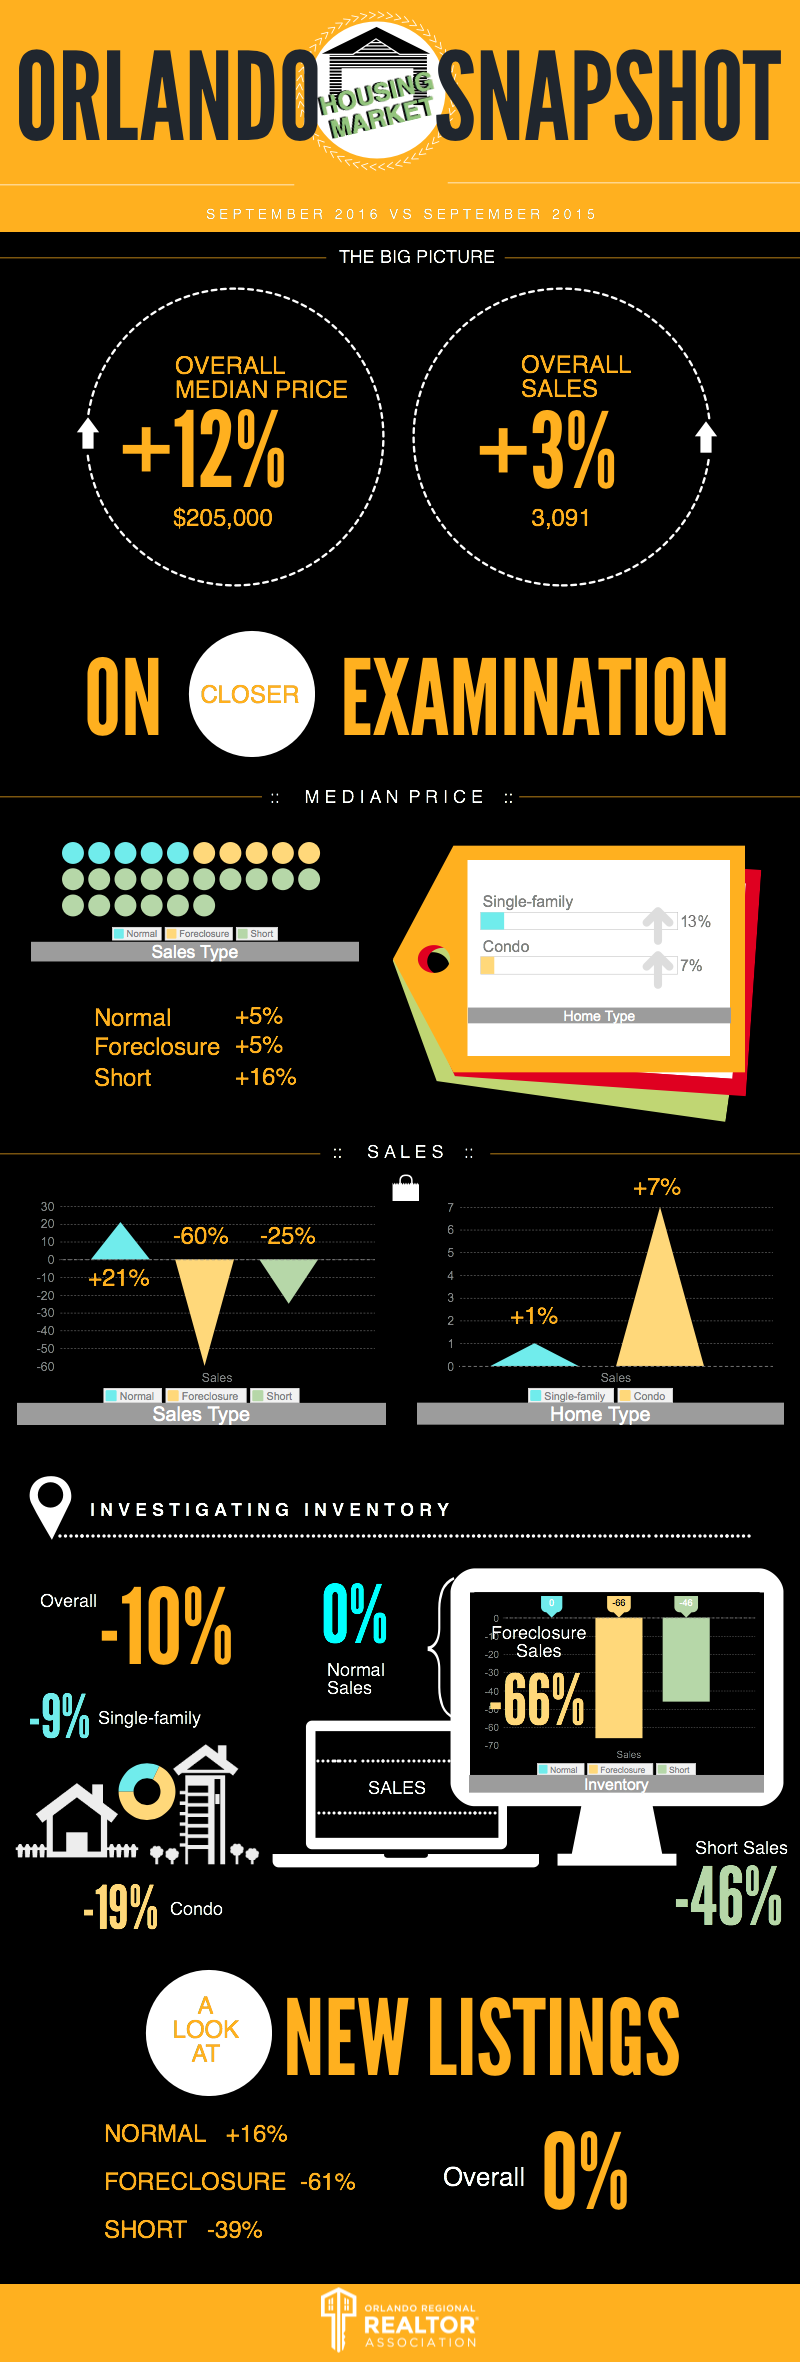 Orlando home sales increase 3 percent as median price continues upward march and climbs 12 percent
The median price of Orlando homes rose 12 percent year-over-year in September, while sales increased by 3 percent. The supply of homes available for purchase in the Orlando area slid downward by 10 percent. “Orlando area inventory currently rests at 10,362 homes, which is both the lowest point this year and the lowest level since March of 2014,” says Orlando Regional REALTOR® Association President John Lazenby, Colony Realty Group, Inc. “Housing inventory in Orlando has declined year-over-year for 15 straight months, which is driving values upward and causing prospective buyers to either waver at the steeper home prices or become disheartened by the competition for the low number of available affordable listings.” “However, a glimmer of hope lies in the increase of “normal” sales that entered the inventory in September as new listings,” continues Lazenby. “While new listings of foreclosures and short sales are plummeting as these sales types disappear from the market, new listings of “normal” sales are up more than 16 percent. REALTORS® are encouraged to see that more traditional homeowners are realizing it is an opportune time to sell and are putting their properties on the market. Median Price The overall median price (all sales types and all home types combined) for the month of September 2016 is $205,000, a 12.33 percent jump compared to the $182,500 median price in September 2015. The median price is steady compared to the August 2016 median of $205,000 as well. The Orlando median home price has now experienced year-over-year increases for the past 62 consecutive months; as of September the median price is 77.49 percent higher than it was in July 2011. The year-to-year median price of normal sales increased 5.39 percent, while the median price for foreclosure sales increased 4.85 percent and short sales increased 15.56 percent. The median price of single-family homes increased 12.50 percent when compared to September of last year, and the median price of condos increased 6.57 percent. Completed Sales Members of ORRA participated in the sale of 3,091 homes (all home types and all sale types combined) that closed in September 2016, an increase of 2.59 percent compared to September 2015. Sales took their traditional August to September fall and decreased by 10.43 percent in September when compared to last month. Sales of normal homes increased 20.52 percent in September 2016, while foreclosures decreased 60.33 percent and short sales decreased 24.78 percent. Sales of single-family homes increased 1.43 percent year over year; condo sales increased 6.51 percent. Homes of all types spent an average of 60 days on the market before coming under contract in September 2016, and the average home sold for 97.06 percent of its listing price. In September 2015 those numbers were 67 days and 96.96 percent, respectively. The average interest rate paid by Orlando homebuyers in September was 3.53 percent. Last month, the average interest rate was 3.49 percent, while in September of last year homebuyers paid an average interest rate of 3.96 percent. Pending Sales Pending sales – those under contract and awaiting closing – are currently at 4,594. The number of pending sales in September 2016 is 14.15 percent lower than it was in September 2015 and 7.29 percent lower than it was in August 2016. Normal properties made up 73.38 percent of pending sales in September 2016. Short sales accounted for 15.59 percent, while bank-owned properties accounted for 11.04 percent. Inventory The number of existing homes (all types combined) that were available for purchase in September is 10.15 percent below that of September 2015 and now rests at 10,362. Inventory decreased by 1.36 percent (143 homes in number) compared to last month. The inventory of normal homes increased 0.07 percent, while foreclosures decreased 65.66 percent and short sales decreased 46.08 percent. The inventory of single-family homes is down by 9.16 percent when compared to September of 2015, while condo inventory is down by 18.75 percent. The inventory of duplexes, townhomes, and villas is down by 3.18 percent. Current inventory combined with the current pace of sales created a 3.35-month supply of homes in Orlando for September. There was a 3.83-month supply in September 2015 and a 3.04-month supply last month. Affordability The September affordability index is 161.74, a decrease from August’s 162.41 percent. (An affordability index of 99 percent means that buyers earning the state-reported median income are 1 percent short of the income necessary to purchase a median-priced home. Conversely, an affordability index that is over 100 means that median-income earners make more than is necessary to qualify for a median-priced home.) Buyers who earn the reported median income of $57,380 can qualify to purchase one of 4,357 homes in Orange and Seminole counties currently listed in the local multiple listing service for $331,570 or less. First-time homebuyer affordability in September decreased to 115.02 from last month’s 115.49 percent. First-time buyers who earn the reported median income of 39,018 can qualify to purchase one of the 2,067 homes in Orange and Seminole counties currently listed in the local multiple listing service for $200,416 or less. Condos and Town Homes/Duplexes/Villas The sales of condos in the Orlando area were up 6.51 percent, with 360 sales recorded in September 2016 compared to 338 in September 2015. Orlando homebuyers purchased 319 duplexes, town homes, and villas in September 2016, which is 7.41 percent more than in September 2015. MSA Numbers Sales of existing homes within the entire Orlando MSA (Lake, Orange, Osceola, and Seminole counties) in September (3,706) were up by 1.17 percent when compared to September of 2015 (3,663). To date, sales in the MSA are down 0.17 percent. Each individual county’s monthly sales comparisons are as follows: • Lake: 2.92 percent above September 2015; • Orange: 1.11 percent above September 2015; • Osceola: 4.66 percent below September 2015; and • Seminole: 4.73 percent above September 2015. This representation is based in whole or in part on data supplied by the Orlando Regional REALTOR® Association and the My Florida Regional Multiple Listing Service. Neither the association nor MFRMLS guarantees or is in any way responsible for its accuracy. Data maintained by the association or MFRMLS may not reflect all real estate activity in the market. Due to late closings, an adjustment is necessary to record those closings posted after our reporting date. ORRA REALTOR® sales, referred to as the core market, represent all sales by members of the Orlando Regional REALTOR® Association, not necessarily those sales strictly in Orange and Seminole counties. Note that statistics released each month may be revised in the future as new data is received. Orlando MSA numbers reflect sales of homes located in Orange, Seminole, Osceola, and Lake counties by members of any REALTOR® association, not just members of ORRA.  Team NRGFL's Oviedo, FL Market Update for May 2016 is now posted.
Below is a list of the recent stats. Number of closed sales: 119 Average Sold Price: $310,822 Number of Active Listings: 210 Average Number of Days on the Market: 41 Days Average Price/Sqft: $131 Average Interest Rate: 3.60% In addition to an increase in the average sales price compared to last year, Oviedo is also noticing a huge growth in new home construction. There are now over 6 large home builders that are breaking ground in Oviedo. More updates to come. 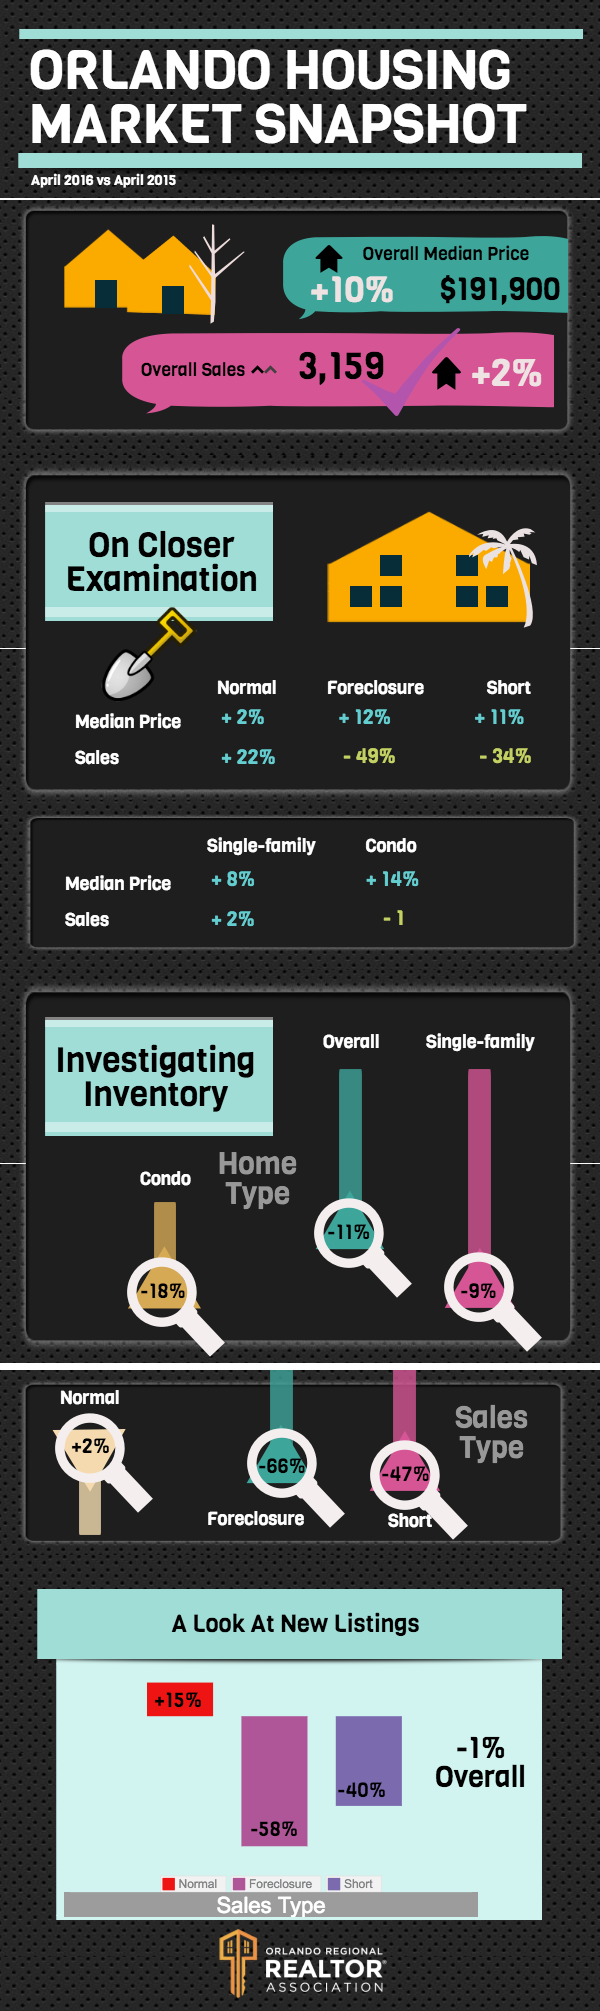 Orlando's home inventory declines 11 percent in April, driving median price upward and stalling sales The median price of Orlando homes shot up nearly 10 percent in April compared to April 2015, while sales increased about two percent. Both the rise in values and the sluggish movement in sales continue be influenced by the area’s ever-declining inventory. “The overall supply of available properties dropped by 10.90 percent year over year in April,” says ORRA President John Lazenby, Colony Realty Group, Inc. “Orlando’s inventory has been dwindling for nearly a year now, with more homes being sold than are being added to the market nearly every month.” “Even though sales are up by comparison, there is just not enough quality choice to meet demand,” continues Lazenby. “At this point REALTORS® are encountering a lot of owners who are tempted by rising values to sell their current home to either upgrade or downsize. But since it’s so difficult to find a replacement they stay put, which further suppresses inventory.” Median Price The overall median price (all sales types and all home types combined) for the month of April 2016 is $191,900, a 9.66 percent jump compared to the $175,000 median price in April 2015. The median price is down 1.59 percent compared to the March 2016 median of $195,000. The Orlando median home price has now experienced year-over-year increases for the past 57consecutive months; as of April the median price is 66.15 percent higher than it was in July 2011. The year-to-year median price of normal sales increased 1.55 percent, while the median price for foreclosure sales increased 11.66 percent and short sales increased 11.45 percent. The median price of single-family homes increased 7.73 percent when compared to April of last year, and the median price of condos increased 13.92 percent. Completed Sales Members of the Orlando Regional REALTOR® Association participated in the sale of 3,159 homes (all home types and all sale types combined) that closed in April 2016, an increase of 1.67 percent compared to April 2015 and an increase of 3.30 percent compared to March 2016. Sales of normal homes increased 22.44 percent in April 2016, while foreclosures decreased 48.53 percent and short sales decreased 34.18 percent. Sales of single-family homes increased 1.68 percent year over year; condo sales decreased 0.81 percent. Homes of all types spent an average of 70 days on the market before coming under contract in April 2016, and the average home sold for 97.10 percent of its listing price. In April 2015 those numbers were 79 days and 95.05 percent, respectively. The average interest rate paid by Orlando homebuyers in April was 3.63 percent. Last month, the average interest rate was 3.70 while this month last year homebuyers paid an average interest rate of 3.69. Pending Sales Pending sales – those under contract and awaiting closing – are currently at 6,075. The number of pending sales in April 2016 is 12.90 percent lower than it was in April 2015 and 4.78 percent higher than it was in March 2016. Normal properties made up 71.62 percent of pending sales in April 2016. Short sales accounted for 15.88 percent, while bank-owned properties accounted for 12.49 percent. Inventory The number of existing homes (all types combined) that were available for purchase in April is 10.90 percent below that of April 2015 and now rests at 10,447. Inventory decreased by 1.29 percent (136 homes in number) compared to last month. The inventory of normal homes increased 1.66 percent, while foreclosures decreased 65.86 percent and short sales decreased 47.42 percent. The inventory of single-family homes is down by 9.30 percent when compared to April of 2015, while condo inventory is down by 17.80 percent. The inventory of duplexes, townhomes, and villas is down by 11.21 percent. Current inventory combined with the current pace of sales created a 3.31-month supply of homes in Orlando for April. There was a 3.77-month supply in April 2015 and a 3.46-month supply last month. Affordability The April affordability index is 169.87 percent, an increase from March’s index of 165.41. (An affordability index of 99 percent means that buyers earning the state-reported median income are 1 percent short of the income necessary to purchase a median-priced home. Conversely, an affordability index that is over 100 means that median-income earners make more than is necessary to qualify for a median-priced home.) Buyers who earn the reported median income of $57,095 can qualify to purchase one of 4,287 homes in Orange and Seminole counties currently listed in the local multiple listing service for $325,986 or less. First-time homebuyer affordability in April increased to 120.80 percent from last month’s 117.62 percent. First-time buyers who earn the reported median income of $38,825 can qualify to purchase one of the 2,104 homes in Orange and Seminole counties currently listed in the local multiple listing service for $197,041 or less. Condos and Town Homes/Duplexes/Villas The sales of condos in the Orlando area were down 0.81 percent, with 369 sales recorded in April 2016 compared to 372 in April 2015. Orlando homebuyers purchased 309 duplexes, town homes, and villas in April 2016, which is 4.75 percent more than in April 2015. MSA Numbers Sales of existing homes within the entire Orlando MSA (Lake, Orange, Osceola, and Seminole counties) in April (3,773) were down by 0.55 percent when compared to April of 2015 (3,794). To date, sales in the MSA are down 1.30 percent. Each individual county’s monthly sales comparisons are as follows: • Lake: 6.13 percent below April 2015; • Orange: 0.92 percent below April 2015; • Osceola: 5.52 percent above April 2015; and • Seminole: 0.14 percent above April 2015. This representation is based in whole or in part on data supplied by the Orlando Regional REALTOR® Association and the My Florida Regional Multiple Listing Service. Neither the association nor MFRMLS guarantees or is in any way responsible for its accuracy. Data maintained by the association or MFRMLS may not reflect all real estate activity in the market. Due to late closings, an adjustment is necessary to record those closings posted after our reporting date. ORRA REALTOR® sales, referred to as the core market, represent all sales by members of the Orlando Regional REALTOR® Association, not necessarily those sales strictly in Orange and Seminole counties. Note that statistics released each month may be revised in the future as new data is received. Orlando MSA numbers reflect sales of homes located in Orange, Seminole, Osceola, and Lake counties by members of any REALTOR® association, not just members of ORRA. Reference: www.OrlandoRealtors.org |
 RSS Feed
|
Call/Text Us: 321-439-4030
© COPYRIGHT 2016. ALL RIGHTS RESERVED.
|
|